

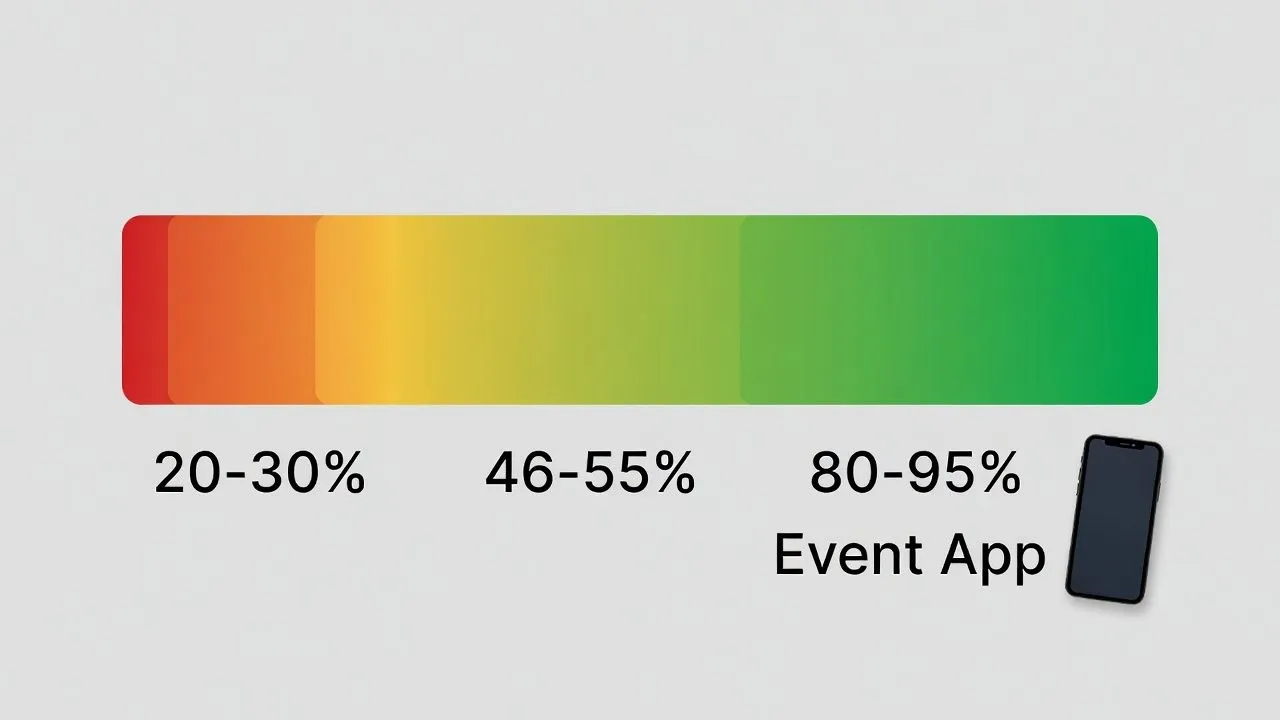
A good event app adoption rate is 55-65%. Without promotion, expect 20-30%. With strategic promotion (exclusive content, gamification, pre-event launch), 55-70% is realistic. Top performers hit 80-95% by making the app mandatory for check-in and killing printed alternatives entirely.
What Is Event App Adoption Rate?
Formula: (Attendees who logged in to event app ÷ Total Registered) × 100
Downloads alone don't count. If someone downloads but never logs in to their event app, they're not adopted - they can't access personalized features.
Benchmarks by Performance Tier
Caveat on sources: The "63% average" from Cvent gets cited everywhere, but the underlying methodology isn't public. Treat industry benchmarks as directional, not absolute. Your event's baseline matters more than someone else's average.
Benchmarks by Event Type
Source: EventMB. These numbers are 2-3 years old - actual 2025 rates may be higher as apps improve.
Benchmarks by Event Size
The mid-size problem is real. 250-750 attendees is the worst spot. Too big for social pressure ("I don't know everyone"), not complex enough to force app usage ("I can figure it out"). If you're in this range, you need stronger incentives than larger events.
What Actually Drives Adoption
Forget feature lists. Two things matter:
1. Does this solve a problem I actually have?
If your app just replicates the printed agenda, why would I download it? But if it's the only way to book a seat in a crowded session, or see who else is attending, or get the WiFi password - now I need it.
2. How annoying is it to get in?
Every friction point kills adoption:
- New account creation for a 48-hour event
- Email verification on venue WiFi
- 100MB download for temporary use
- Permissions requests I don't understand
The psychology term is "Perceived Ease of Use." Translation: if it's annoying, people won't do it.
What Kills Adoption (From Real User Complaints)
These come from Reddit threads, Twitter, and event forums - not vendor marketing:
Login friction - Registered 3 months ago with work email. At venue with personal phone. Can't remember password. WiFi is garbage. Give up.
Offline failures - App shows blank screen when venue WiFi buckles. 5,000 people, one router. You do the math.
Battery anxiety - Background location tracking drains battery by noon. Now I can't access my ticket. Uninstall.
Permission creep - Why does an event app need my contacts, camera, location, AND Bluetooth? Privacy flinch → deny all → app is useless.
How 80-95% Events Actually Do It
Nunify case (99% adoption): Promoted the app once registration was confirmed. Clearly highlighted why to use the app. This in itself got about 25% downloads, but every week emailers kept going out with an early-bird winner. While with the internal event app the big push was FOMO - In-app contests created a word-of-mouth virality to get the app to participate or see contests.
Whova case (91% adoption): CRA-W Grad Cohort launched the app weeks early and asked attendees to submit song requests for the reception. Low-stakes, fun interaction. By event day, everyone had already overcome login friction.
Cvent case (90% login rate): Georgia Bankers Association integrated the app with registration. No new account needed - data flowed automatically. Zero friction.
Pattern across top performers:
- Launch app along with registration
- Promote it periodically and for sure 2-4 weeks before event, not day-of
- Pre-populate profiles from registration data
- Make app required for badge pickup
- Kill the printed agenda entirely
- Create pre-event contests and use of the app
- Dedicated app help desk on-site
- Prizes for engagement (real ones, not swag)
- Don’t forget the post-event. Continue engagement and publish videos, ppts in the app.
Where This Data Falls Short
I'll be honest about the limitations:
- Most benchmarks come from app vendors citing their own customers. Selection bias is obvious.
- "Adoption" definitions vary. Some count downloads. Some count logins. Some count "active users." Compare carefully.
- Regional differences aren't captured. For example India and US attendees interact with apps differently.
- The 2020-2023 data is skewed by pandemic-era virtual events. 2024-2025 norms are still stabilizing.
Use these benchmarks to set expectations, not to grade yourself.
Quick Reference
Good adoption rate: 65-75%
Bad adoption rate: Below 30% means something's broken
Exceptional: 80-95% (requires mandatory app integration)
Target by scenario:
- First event with an app: 50%
- Established event: 65%
- App required for entry: 85%+
Sources
- Cvent Mobile Event App Benchmark Report (2017-2018): 48.5% average adoption across 2,000+ events. The "63%" figure appears in later Cvent UK blog content but methodology isn't public. Business Travel News coverage
- EventMB/Skift Meetings industry statistics: 64% training/workshops, 61% conferences. Skift Meetings
- Nunify 99% adoption internal event case study (FOMO-driven contests + weekly early-bird winner emails)
- CRA-W Grad Cohort 91% adoption case study. Whova Blog
- Reddit r/eventprofs threads on app complaints
- Twitter/X event industry discussions
- Technology Acceptance Model (TAM) - academic research on Perceived Usefulness and Perceived Ease of Use as adoption predictors
Stat Caveat: Most industry benchmarks come from app vendors citing their own customer data. Treat as directional guidance, not absolute truth.